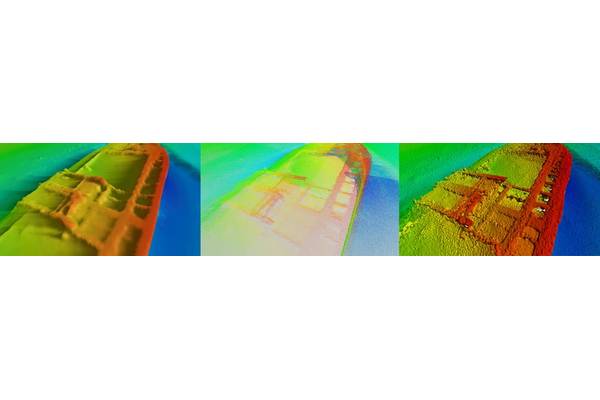
When using dense, high-precision survey data, the method for management and visualization of the data can have a large impact on the final decision making process. This is an important factor when accurate shape reconstruction is required, as there are significant trade-offs with traditional approaches. For applications where it is critical to know exactly the shape and size of surveyed objects, a high-resolution 3D mesh is likely the best option.
Gridded surfaces, even with variable resolution, cannot adequately model complex overlapping or vertical structures. Though we think of grids as 3D objects, they are referred to as having 2.5 dimensions because of this limitation of being able to only represent a single vertical value per grid cell. Alternatively, point clouds can represent any shape or structure, but by themselves pose challenges for visualization and quantitative analysis. To address these limitations and bridge the benefits of both point clouds and gridded surfaces, QPS has created tools for creating and working with high resolution 3D meshes, directly in the QPS Fledermaus software package. The new techniques can be used with the majority of common survey formats, with data coming from photogrammetry, LiDAR, or multibeam. The primary requirement is that the data is dense enough to support the 3D reconstruction process.
Supporting Structure From Motion
Before adding functionality for creating new meshes, Fledermaus supported the importing of meshes created using Structure From Motion (SfM) techniques in 3rd party software, such as Agisoft Metashape and Pix4D. Users desired improvements for better handling of large meshes, and wanted the same functionality they were used to when working with gridded surface. This included operations such as applying color maps, measurement tools, and interactive profiling.
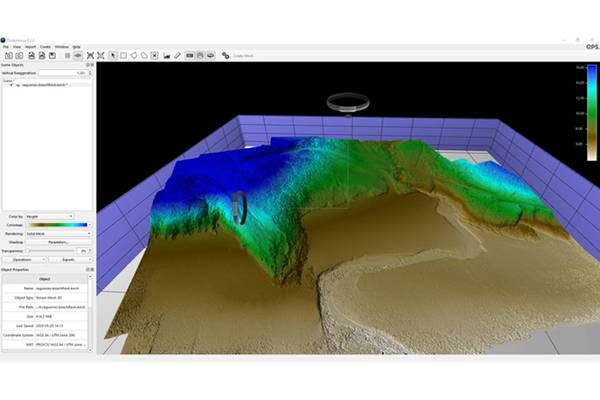
Initial applications for these tools were coastal and near shore mapping and analysis, with data acquired from aerial drones. Figure 1 illustrates an example of an inter-tidal area represented as a mesh in Fledermaus. With rapid advancements in lighting and camera technology, SfM tools were also applied underwater, with impressive high density point cloud produced from ROV and AUV video, as shown in Figure 2 (Data source: USS YP-389 NOAA/Project Baseline). One of the key benefits of a 3D mesh can be seen in the overlapping and protruding structures of the wreck. These features would be averaged out when using a grid, and would be more difficult to see in a point cloud.
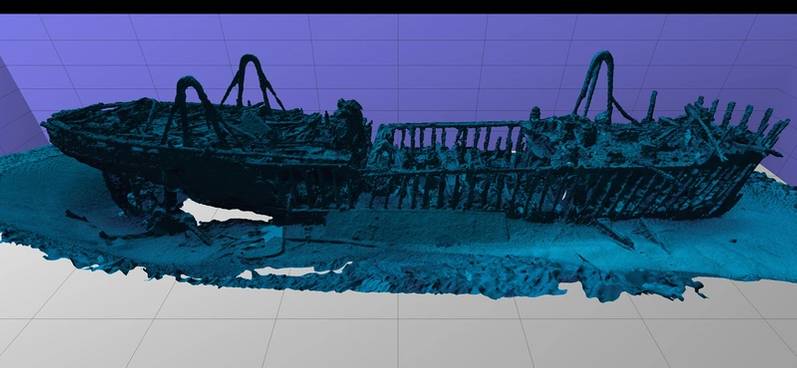 Figure 2 (Data source: USS YP-389 NOAA/Project Baseline)
After adding support for meshes created in 3rd party software, the next major step was adding the ability to create new meshes from point clouds. This ability was first introduced in Fledermaus 8.0, and the process has been improved in each follow up release. To maximize the benefits of adding a new data structure to your workflow, the creation process needs to be accessible, and well integrated. To achieve these goals, the Fledermaus mesh creation tools were designed to be almost as simple as creating a standard gridded surface.
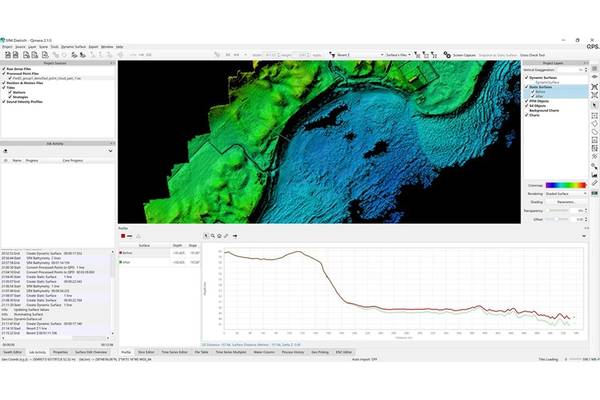
In addition to opening up the mesh creation process to both multibeam and LiDAR data, this also allows SfM derived point clouds to be improved before mesh creation. There are often times when SfM data requires further processing, because of deficiencies in the original pre-built mesh. By using the point editing and QC tools in Qimera software, the point cloud data can be improved, and a more accurate mesh created in Fledermaus. There are also specialized tools, such as the SfM add-on for Qimera, which can be used to correct for refraction errors in submerged data acquired from airborne photogrammetry, as shown in Figure 3 (Data courtesy 4DOcean). The image shows a beach profile running from land to underwater with the original terrestrial and bathymetric SfM points, and the refraction corrected SfM terrain model derived from the same source, but after the correction. The original terrain model's profile is colored in Red and the corrected one in Green. Within Fledermaus, the mesh tools use the Poisson surface reconstruction algorithm (Kazhdan et al. 2006) for creating a best-fit surface of a dense point cloud. A key part of the mesh construction is determining the orientation, or shape from the point cloud. By using a data source with recorded navigation and orientation data, Fledermaus can make an improved mesh compared to generic mesh creation algorithms.
Applications of a 3D Mesh
In terms of applications, this technology is beneficial anywhere that accurate shape reconstruction is of utmost importance. This can apply when proper identification and measurement of features is critical to risk management, and to a greater extent in situations where there will be close interaction with the surveyed objects. When performing marine salvage, construction, or asset inspection, it is critical to have the most comprehensible and accurate representation of the data.
These applications highlight the differences between historical usages of mesh structures, and the new techniques now being introduced. Representations such as triangulated irregular networks (TIN) have been a common part of surveying for many decades. However, there have been major changes driving a completely new approach to how meshes are created and used. Instead of using a mesh as a way to create an interpolated shape from a sparse set of points, the abundance of dense point data now allows for the most accurate representation possible from the source point cloud. In addition, there has also been the transition from 2.5D meshes, to true 3D structures.
The change to high resolution 3D meshes has been enabled by three factors:
• Growth in CPU and GPU capacity, especially in regards to multi-core processing
• Advancement in shape reconstruction algorithms
• Increased availability of dense, high precision point cloud data
Multibeam Sonar
Applying the mesh tools to a traditional multibeam survey, Figure 4 shows an example in shallow water of data collected with a Kongsberg EM2040D of 4 shipwrecks. At this scale, there is no discernible difference between the 10cm mesh and the 10cm grid.
Looking closer at the data, Figure 5 can better highlight the differences between data structures. The grid still provides some details, but comparing it to the original point cloud, there are missing details and the overall dimensions are distorted. The mesh provides a much better preservation of the shape, and full dimensions of the object.
The most immediately visible benefit of a 3D mesh is the ability to model areas with overlapping z values, such as slopped walls, or protruding structures. This is easily visible in the wreck show in Figure 2. A complimentary benefit is that the mesh is a variable resolution structure. When creating a mesh, you provide a minimum resolution, and the creation algorithm will adapt the resolution as needed based on point density and the shape itself. Lastly, mesh creation can also reduce the data volume while still preserving shapes and structures. In the example from Figure 4 & 5, the original point cloud had just under 8 million points, but the mesh was able to reduce that to 2.5 million vertices, while also helping to improve visual analysis.
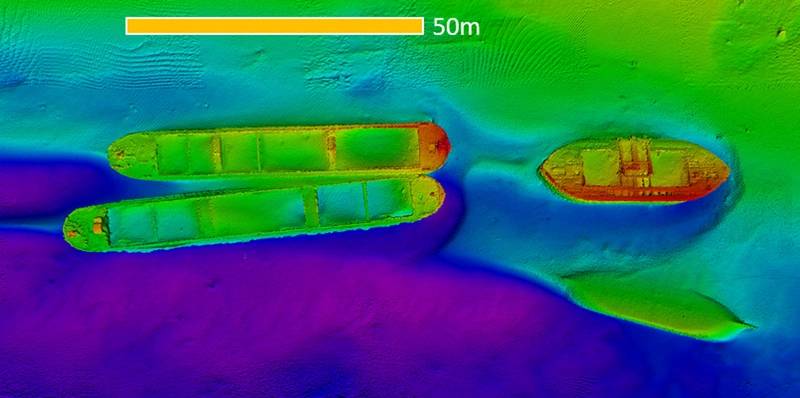 In the example from Figure 4 (pictured here) & 5, the original point cloud had just under 8 million points, but the mesh was able to reduce that to 2.5 million vertices, while also helping to improve visual analysis.
Revisiting the comparison of a 3D mesh with a standard grid, the downside is that a grid is limited as a 2.5D surface, which can only represent one Z value or depth, for each grid cell. This prevents accurately representing quickly changing slopes, overhangs, or any protruding structures. The advantage is that grids are quick to build, and easy to understand. A variable resolution grid can address some of the limitations of a standard grid, but ultimately it is still restricted by it being a 2.5D surface that cannot accurately represent certain shapes. In situations where accurate reconstruction is required, a grid should not be used for detailed planning or measurements.
Comparison with Point Clouds
In a similar comparison for point clouds, we can see that points have the advantage of no additional building time, compared to grids and meshes. As your point density and resolution increases, mesh construction can be resource intensive. However a modern multi-core machine can help offset this, with a close to linear reduction in build times with each additional CPU core. Points naturally represent objects at the full resolution of the sensor, with 3D meshes usually coming close to the same.
The largest potential downsides of a point cloud are that it is not a connected shape, which complicates quantified analysis, such as slope or volume calculations. Also point clouds can be challenging for visual perception, as you are seeing either too many points at once, or obstructing fine details.
What is best?
Considering the complimentary benefits and trade-offs, the best approach is to work with a combination of data structures, to best fit the situation and data. There can also be complementary applications between data structures, such as combining a medium resolution mesh with a point cloud to help create structure, and occlude points on the backside of the point cloud. This improves the visual perception of the points, without needing the time to create a high resolution mesh.
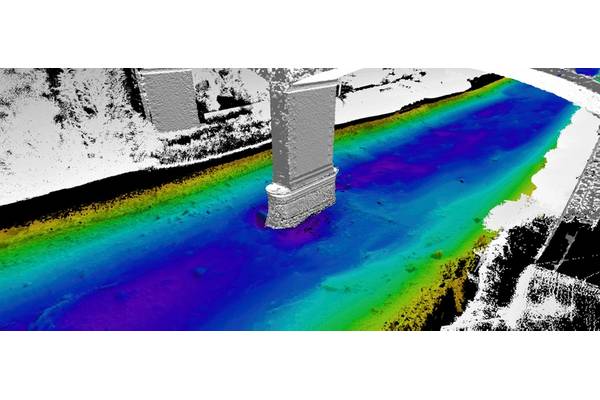
A more complex example is when working with a large multi-sensor survey. This can be examined using a sample data set from Bibby Hydromap, a former survey company based in the UK. The asset inspection survey combined data from a Reson SeaBat T20-P multibeam, a Blueview scanning sonar, a Carlson Merlin laser scanner, and also airborne LiDAR. Figure 6 is an example of one area of the survey, and shows multiple different data structures used together in one scene.
The multibeam data of the riverbed is represented with a regular grid, as that is quick to produce and is a good match for the bathymetry. Areas of interest on the riverbed can be selected and 3d meshes created as needed. To best identify problems, the bridge is a 3d mesh combining the laser scanner, the scanning sonar, and the aerial LIDAR points. Additional laser points, such as the surrounding vegetation, are left as a point cloud, as direct analysis is not needed for those points.
Maximizing your Point Clouds
There are significant costs associated with collecting and processing dense, high-resolution point cloud data. To maximize the return on those costs, it is important to have a set of tools that can best leverage the investment in collecting the data. The QPS suite of tools can support a workflow focused on creating the highest quality 3d data possible. For example, using the new 3D point filter in Qimera 2.2 with the latest mesh technology in Fledermaus 8.2, is a powerful combination. Applying these tools to a data set collected with an R2Sonic Sonic 2024 multibeam operated in UHR (700kHZ) mode, provides a great example of what can be achieved, as shown in Figure 7. In future versions the technology and capabilities for 3D meshes will only improve as more tools are developed to integrate this new data type into various workflows.
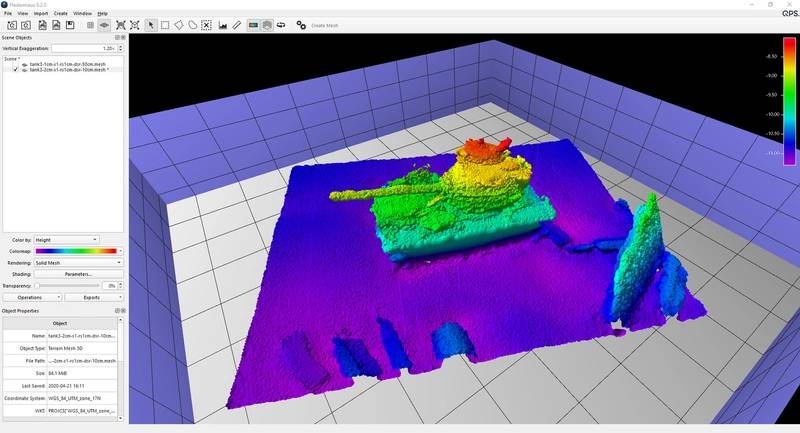 Figure 7