The offshore support vessel (OSV) market is very much a global industry where ships frequently mobilize between regional markets. This offers far more opportunities than markets more closely linked to their specific local geography and operational patterns. As a result of these additional opportunities, the supply- and demand balance in the respective regions are more dynamic than the offshore activity therein in isolation, which has allowed for a faster market recovery in the upcycle we are experiencing today.
A good example of this market dynamic in action can be observed between Southeast Asia and the Middle East where the respective market balances developed in vastly different fashions. In the former, we observed a tremendous oversupply of OSVs for the better part of the last decade on the back of the preceding newbuild boom. Especially towards the latter stages of the previous market cycle, newbuilds were predominantly delivered by Asian shipyards. In the absence of sufficient market demand, however, many, in fact the majority of which, quickly saw themselves idle or laid up.
At the trough of the market, in 2016 and 2017, there were more than three and four times as many AHTS and PSVs in Southeast Asia as the market demanded respectively. This, of course, put significant downwards pressure on dayrates and utilization, and thus saw a whole host of vessels put into lay-up in order to reduce Owners’ operational costs until the market recovered.
Meanwhile, the Middle East saw offshore exploration and production (E&P) activity growing steadily through this same period and as a result vessel demand even accelerated quite counter cyclically at times. Especially so for the number of working PSVs as well as the number of AHTS engaged on long term contracts, which both saw growth at times when most other regions were in decline or at their through.
Granted, dayrates, and even utilization, grew only modestly during this time, but saw growth, nonetheless. Moreover, the additional demand in the Middle East allowed a large number of idle OSVs from other regions to migrate here and as such helped stabilize the market balances elsewhere that would otherwise been worse.
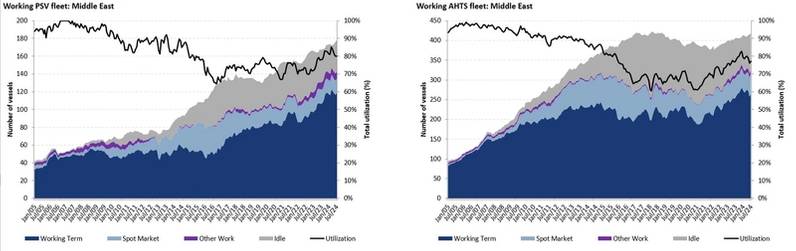 Number of PSV and AHTS Working in the Middle East
Source: S&P Global Commodity Insights.
A large-scale migration of OSVs also occurred in other regions that were heavily impacted by the market crash, and in relative terms, few, if any, other regions saw a larger exodus of vessels than the North Sea. Granted, a large part of the vessels that found themselves laid up along the Norwegian costs especially, were ships that had returned home for this purpose after having traded internationally prior to the crash.
When examining the market balance for PSVs and AHTS in this area, it becomes clear that the total number of vessels in the two fleets during the first quarter of 2017 outnumbered the previous peak demand by around 30%. While the market did see some momentum for vessel activity in this region, the total vessel demand is still significantly lower than before the crash. Additionally, it is worth noting that market demand today is even significantly lower than the momentum achieved prior to the activity halt brought on by Covid-19.
Despite this weak development on the demand side, both utilization- and overall dayrates have increased tremendously since the trough. This tells us that the strongest driver has not been demand, as one might expect, but in fact a reduced supply side as a result of a mass exodus of vessels. Even more so, when looking at the total number of OSVs in the North Sea region, we find that this figure is currently at its smallest in almost 20 years for PSVs and for even further back for AHTS.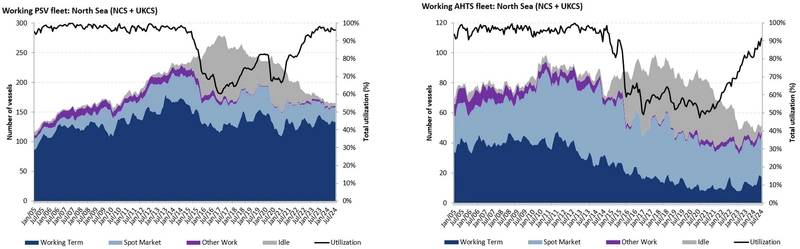 Number of PSV and AHTS Working in the North Sea
Source: S&P Global Commodity Insights.
This timeframe is unfortunately far from a coincidence and what it tells us further is less than encouraging. The UK, which together with Norway represent the vast majority of offshore activity in the North Sea, hit its peak production already back in 1999 at around 4.5 million barrels of oil equivalent per day (boepd). And while there was some renewed momentum after the oil price crash in 2014, it pales in comparison to historical levels and the country’s current output stands at only around 1.3 million boepd.
Furthermore, the British government’s recent decision to increase the windfall tax on oil and gas (O&G) producers does little to change this development. Late in July, the new Labour government announced that it will (yet again) increase the Energy Profits Levy by 3%, which brings the headline rate of tax up to 78%. Moreover, in an effort to shift investments into cleaner energies, it will also terminate the 29% tax offset allowance on capital re-invested.
Perhaps this column is not the best place to discuss the effects of carrots versus sticks, but we would argue that the only certain effect of these recent changes is that volume of investments will see another turn for the worse herein. And while there is something to be said for the politics of energy security, the impact on offshore activity, and as such, vessel demand, is thus likely to further decline.
The level of O&G investments in the other major offshore country in the North Sea region, Norway, has seen something of a renaissance in the last couple of years. The tax scheme incentive package that was initially offered in order to counter the negative impact Covid-19 had on the country’s O&G industry saw 13 new greenfield development in addition to a several brownfield plans representing around NOK 300 billion in investment announced through 2022.
Moreover, the country’s production development has also maintained a far greater momentum than that of its neighbour. At the start of 2024, Norway’s O&G production was a little north of 4 million boepd, which is just around 12% lower than its peak production back in 2004. And although a large portion of the new field development are subsea focused, tie-backs or other types of developments based on existing infrastructure, it still maintains a significant level of vessel demand.
It should be mentioned, however, that the O&G industry as a whole has taken huge efficiency strides during the last decade, both in operations as well as technological aspects. More efficient drilling operations and an increased market share of the production infrastructure going on the seabed floor compared to topside means less vessel demand for PSVs and AHTS compared to more conventional developments.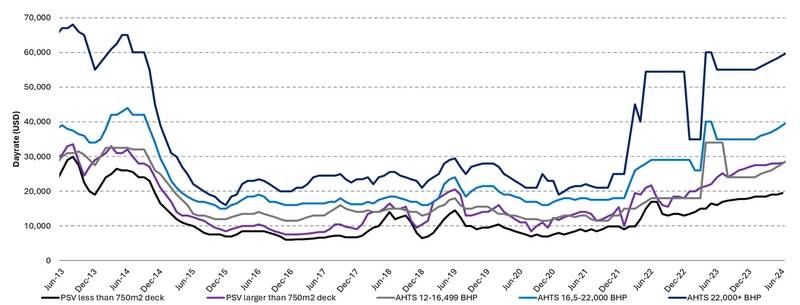 North Sea Term Dayrate
Source: Fearnley Offshore Supply.Overall, the market in the North Sea certainly has recovered from the doldrums of past years and, as seen in the graph above, dayrates for term work is currently at levels last seen in 2014 measured in USD. Yet this is without adjusting for inflation, and while we report higher utilization rates as of late these figures admittedly concerns a smaller number of vessels than prior to the downturn.Even more so, it is also important to consider just how persistently fragile the market balance in the North Sea region is. The UK and Norway now have roughly the same amount of AHTS and PSVs. The total demand for supply vessels on the Norwegian side has developed relatively flat and is not likely to accelerate within the near future. With an absence of activity in the UK side, the historically busy summer season we just went through was a let-down for a lot of the shipowners in the region.
In the spot market, average dayrates for PSVs in July were just GBP 12,500 for large vessels with fixtures reported as low as GBP 5,000 – this in one of the most important months of the year. AHTSs fared quite a bit better, averaging around GBP 56,000 per day, yet herein the utilization during the month as a whole could certainly improve.
Meanwhile demand for OSVs continues to rise firmly almost across the board with calls for international tonnage to participate more often than not. As for the rationale behind mobilizing further vessel out of the North Sea it becomes abundantly clear when comparing term dayrates across key offshore regions. The graph below, which shows regional distribution of term dayrates in USD at the end of the second quarter, tells us that the North Sea is lagging behind other comparable regions, so why would you not seize opportunities that arise elsewhere?
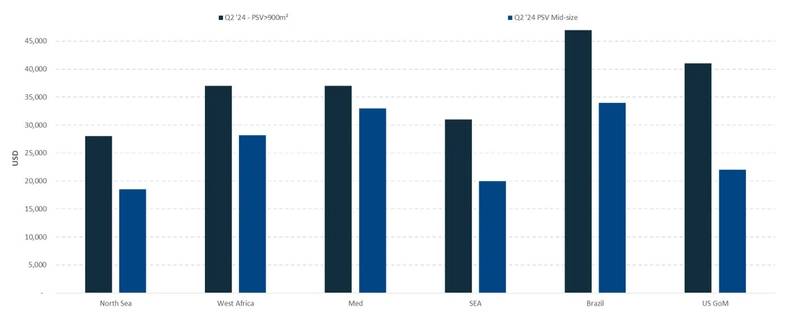 PSV Term Dayrates by Region 2Q 2024
Source: Fearnley Offshore Supply
In conclusion, we remain positive about improving market conditions in the OSV industry as a whole and in the North Sea region overall. Yet we need to maintain a certain degree of realism to what has been the main driver behind positive development and what we can reasonably expect going forward. We find it difficult to see local market demand impact dayrates herein, but rather expect continued vessel demand globally to likely see more vessels mobilize out of the North Sea.
 Subscribe